On Friday last week, Ian asked about whether it is possible to create a smooth animation between a cartesian and polar graph that isn't forced. I came up with a couple of animations that could be used.
This is the desmos graph I used. Links to an external site.
Basic summary is, controls the animation progress. controls which animation is used and can be set to either , , or . The curve and grid can be enabled and disabled by turning on and off their respective folders (I think the lined grid looks better, but the dotted one is significantly more performant). The properties of the grid can be modified in the "Grid configuration" folder (turn on the folder to get draggable points for the bounds of the graph). Some options for specific aspects of the animations are available in the "Animation Parameters" folder. The Infinite Smooth Looping folder allows you to create a loop like the one in the gifs. The "Animation Functions" folder contains the animations themselves. The animations actually aren't that complex, they were just made crazy complicated by the toggleable options. Because of this I created a separate folder named "simplified animation functions", which contains simplified versions which assume that all the toggleable options are turned off.
Linear Interpolation
The most obvious solution is to linearly interpolate between the
graphs, that is, take all the points on the linear graph and move them
in a straight line to their position in the polar graph. I think this is
the solution that Ian came up with in class.
It
certainly works, but it's a bit confusing to look at, since it crosses
over itself a lot. This becomes a big problem with longer graphs. On top
of this, it doesn't give an intuitive idea of how exactly the graph is
being transformed, so you can't really use it as a tool for graphing
equations in your head.
Spinning one graph around the other (Spin uniform)
The easiest way to understand this one is just to see it.
You may notice that this results in the wrong graph. This is because of a very frustrating fact: is parallel to the y-axis and moving in the direction goes clockwise (when ), while is parallel to the x-axis and moving in the direction goes counter-clockwise (when ). This means that the graph has to flip itself over and rotate a quarter turn!
One solution to this problem is to place the initial graph in a transformed position.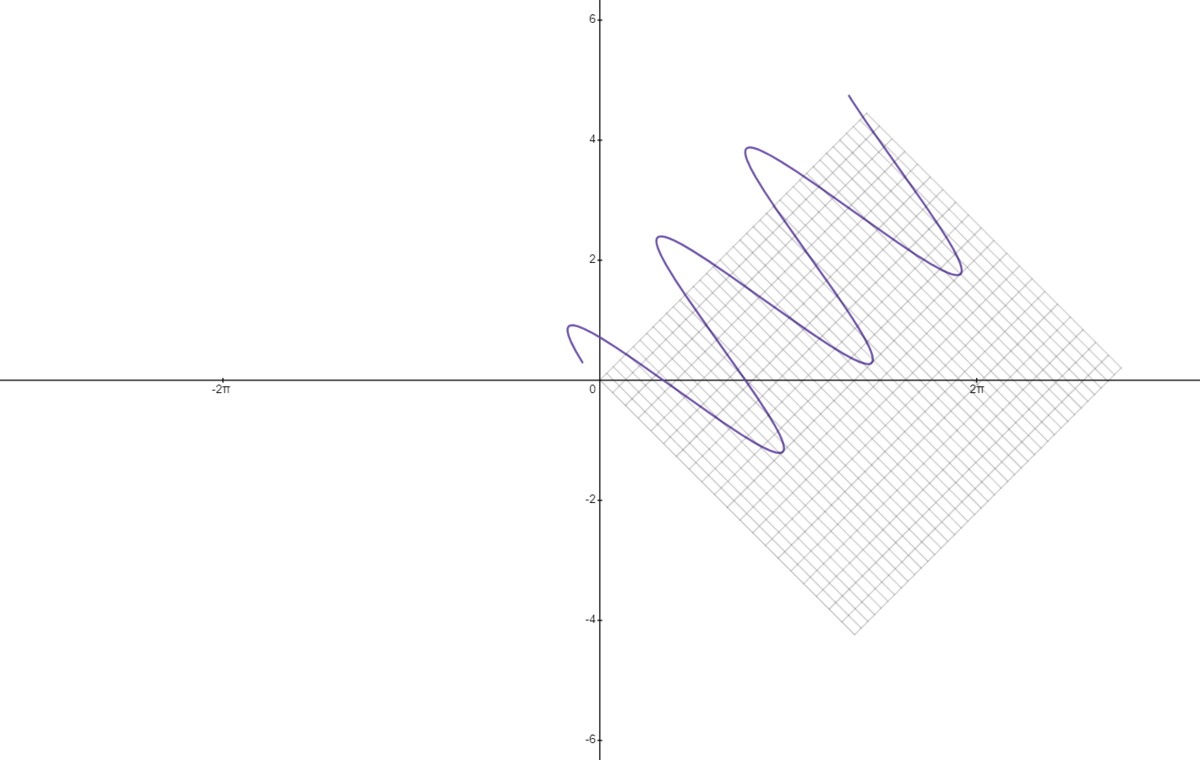
This
graph is a little tough to align. It has to be aligned at the final
angle, so that the first point can be spun all the way around and ends
up at the initial angle. The whole graph is perpetually moving and only
ends up correct once the animation is complete. For these reasons I find
it quite difficult to imagine, but it's possible, unlike the linear
interpolation.
Another way of doing this is to rotate the cartesian graph, instead of the polar one.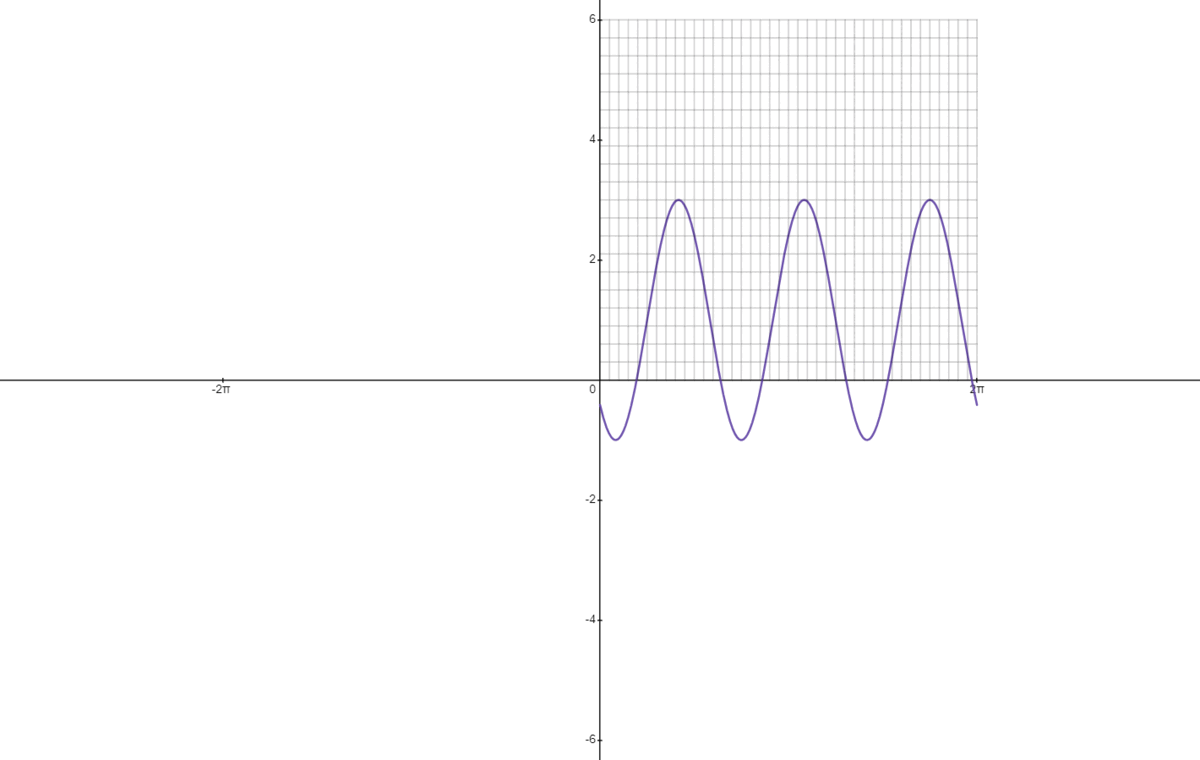 Once again, this results in the wrong graph, so I'll use the method described before to fix it.
This
one is aligned so that it starts at the initial angle, which is more
intuitive. Once the polar graph is placed down, it will stay there and
that will be its final position. Personally, I find this one the easiest
to imagine and is usually what I use to graph polar equations in my
head.
Spinning the graph into place, but at different speeds (spin)
This one is a little hard to understand. Basically, when the
animation is a certain proportion complete, the x positions will be
translated toward the origin by that proportion and the whole graph will
be rotated by that proportion of it's x position. So if the animation
is complete, the graph will be translated of its original x (horizontal compression by a factor of ), and will be rotated by of it's x position.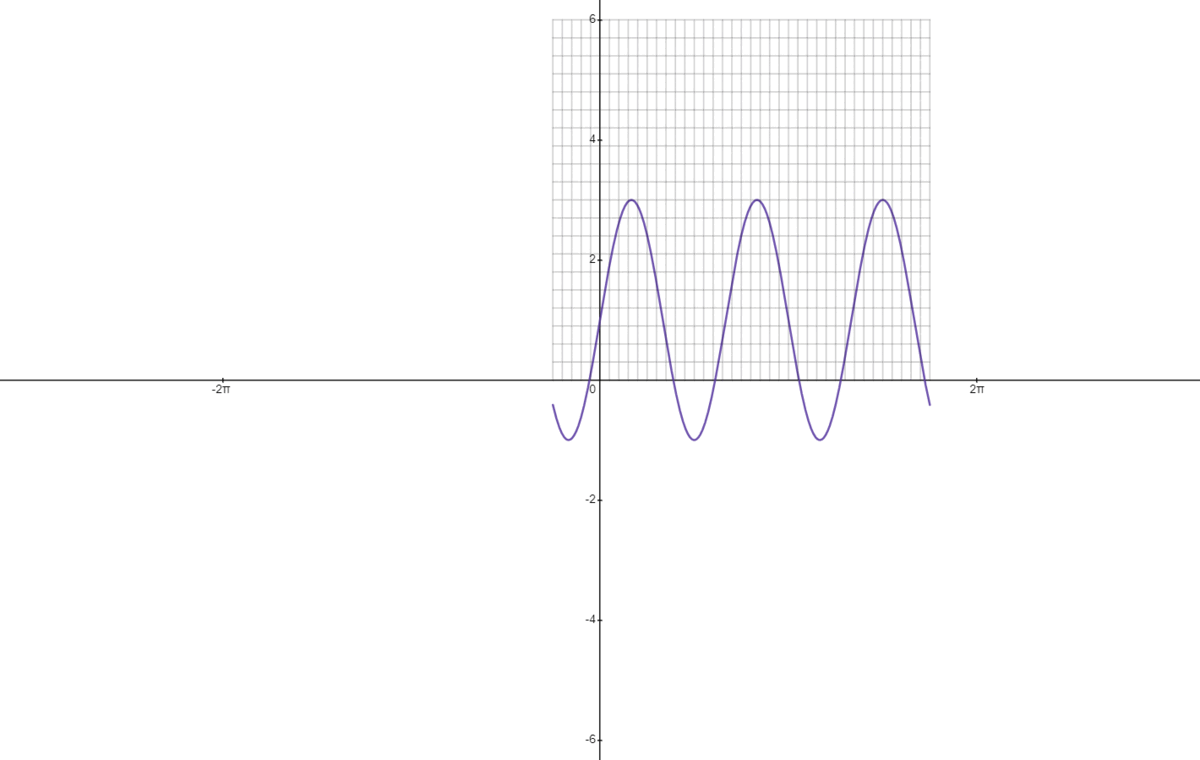
I
find this one quite quite unintuitive. It's more fluid than the ones
where one of the graphs is spun, making it reminiscent of linear
interpolation, with the major difference of it capturing the rotation
that is fundamental to polar coordinates.
Even though this one actually does end up in the right
position, the graph will still have to flip over itself over and rotate
sideways. I can use the method I used for the last two graphs to remove
this.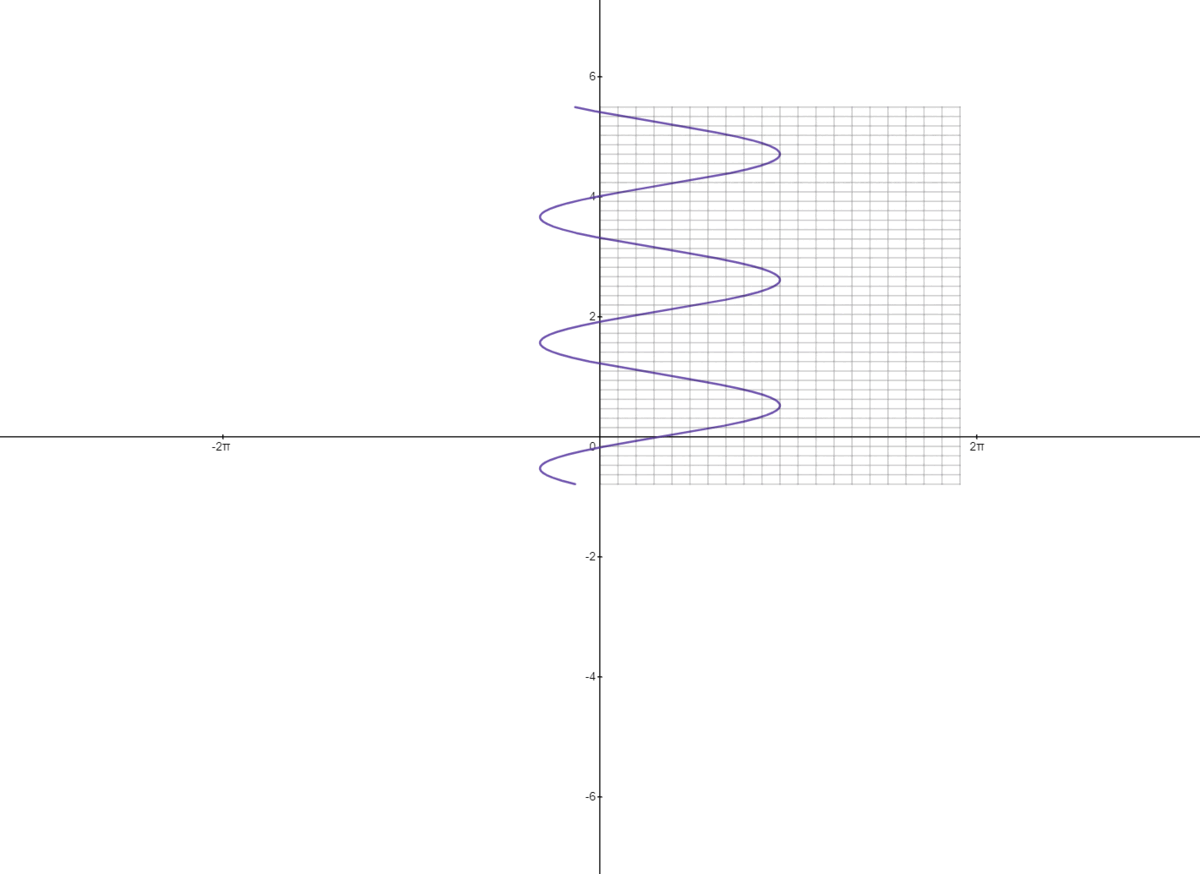
This makes it much cleaner!
And now for the sponsorship portion of this post! Are you wondering how I created these beautiful gifs? I did it with DesModder Links to an external site.! A browser extension that adds a whole bunch of great features to Desmos, such as a gif creator, and a button to turn the app into a text based programming IDE complete with syntax highlighting and intellisense!
If you have any questions about anything, feel free to ask!
Also, if you have better names for any of these things please tell me!